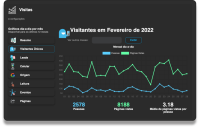
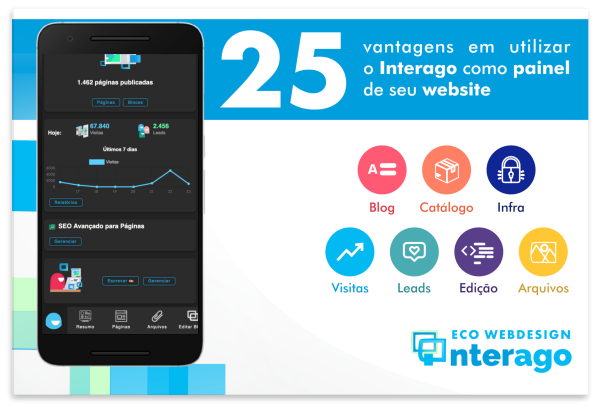
Interago is our Digital Experience Platform, that is, the Panel we use to operate our clients' websites.
In addition to content management and easy maintenance and updating, our tool offers a series of charts and reports which are entirely based on marketing interests in relation to the website, such as:
- How many contacts does the website receive?
- Does the website appear on Google? How many times?
- Is my site getting worse or better?
- How many different people access my website?
We offer real-time updated charts to track more than 20 different metrics by 5 years. In addition, our monthly consummated reports are sent every month automatically to the email and whatsapp of our customers, thanks to the Interago robot 🤖
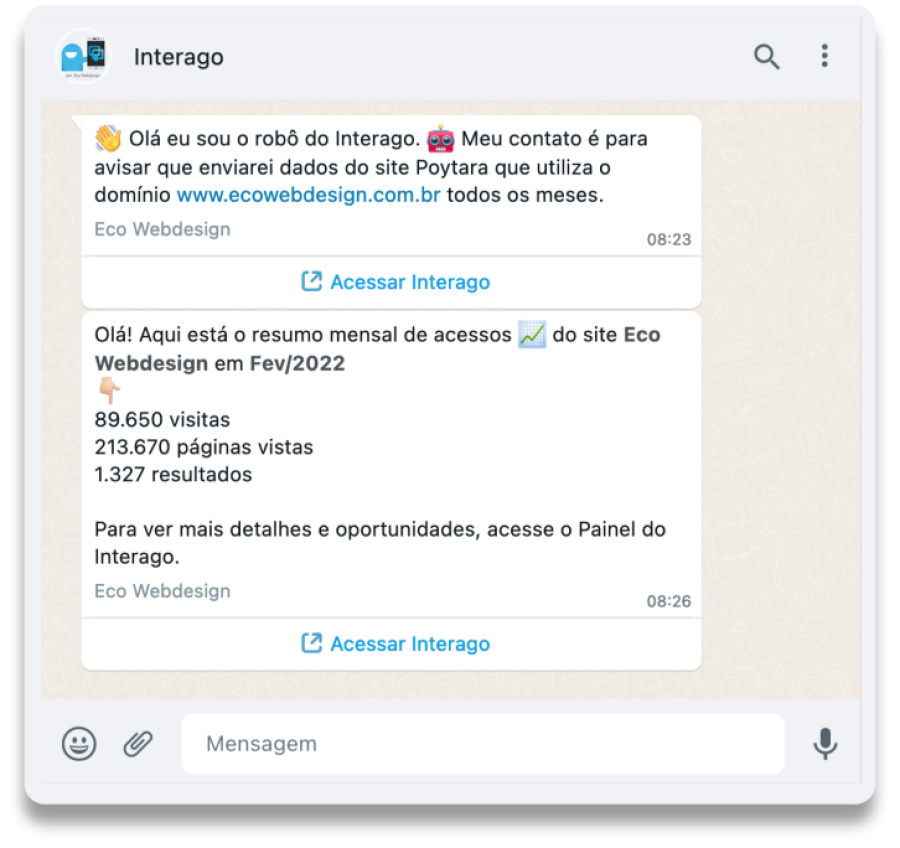
All our customers can register 1 number by Whatsapp to receive the report automatically every month, in addition, the message has a access link to view detailed reports.
Main types of reports available
To see all the reports it is necessary have a client user and website access. Reports are available in the tab Visits on the menu.
We offer 2 types of charts:
- month by month: Where you can filter year by year by the last 5 years;
- day by day: It is possible to see in real time the progress of the month in exercise or data of months in an interval of 6 months;
Summary of reports below:
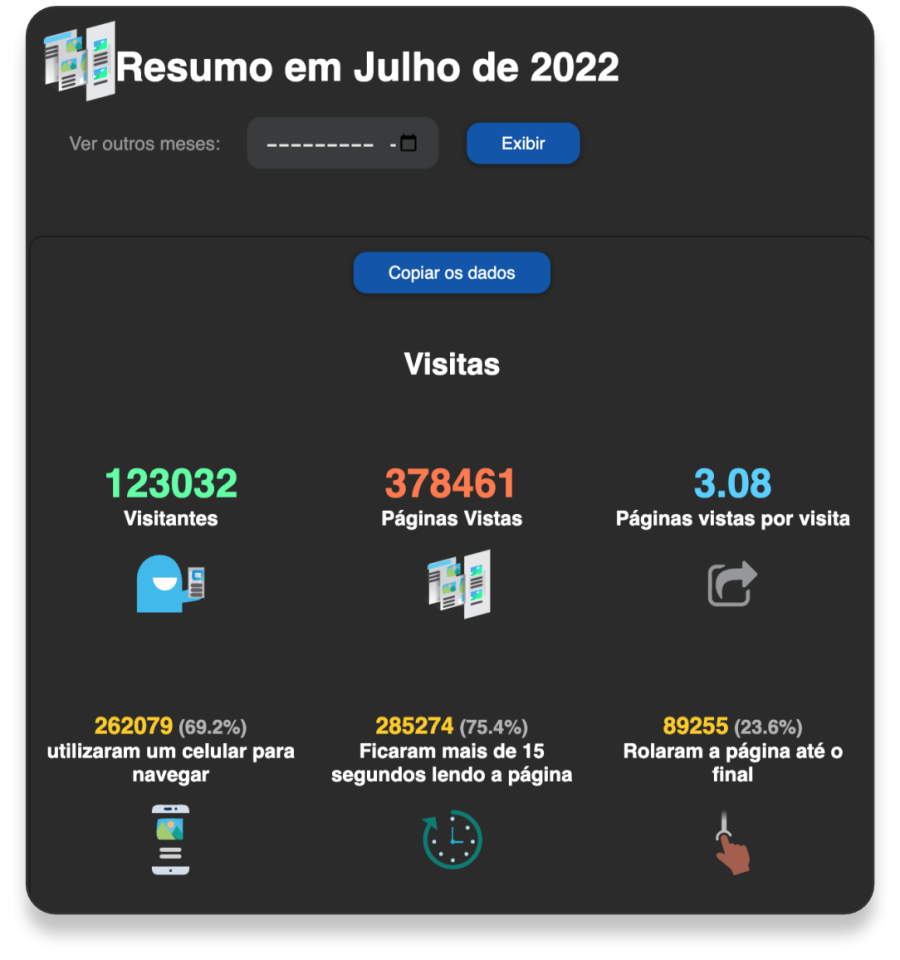
monthly summary
The monthly summary report provides the main information of the last month simply and instantly, as it is pre-compiled.
The button copy the data lets you copy content to share or export to a spreadsheet, for example.
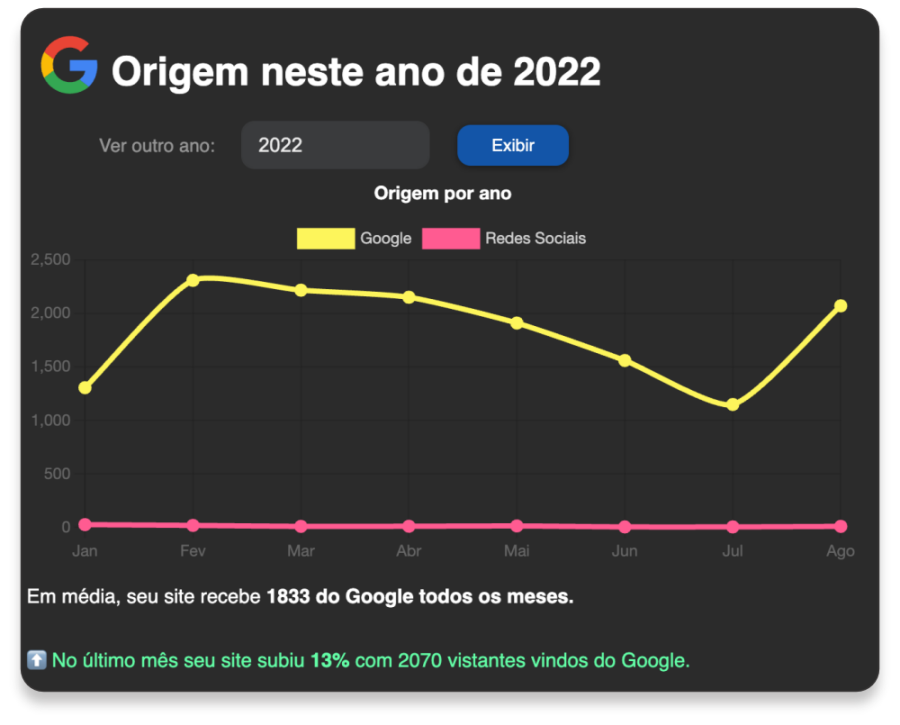
Source
Like SEO and Google campaigns (see our Google Partner certificate) are in our veins, we need to understand perfectly if the site is going down, stable or up in searches. In addition, we also monitor access from the main social networks, such as: Facebook, Instagram, TikTok and Whatsapp.

reading and scrolling
This graph allows you to understand how the visitor is absorbing your content, taking into account the time they spend on the page and also if they reach the end with the scroll bar.
You can segment by pages to see the performance of each page individually.
In addition to these, there are several other reports that seek to meet marketing needs, such as the example at the end of the article with details of events such as clicks to send a message via Whatsapp, make cell phone calls, calculate routes and forms in general.
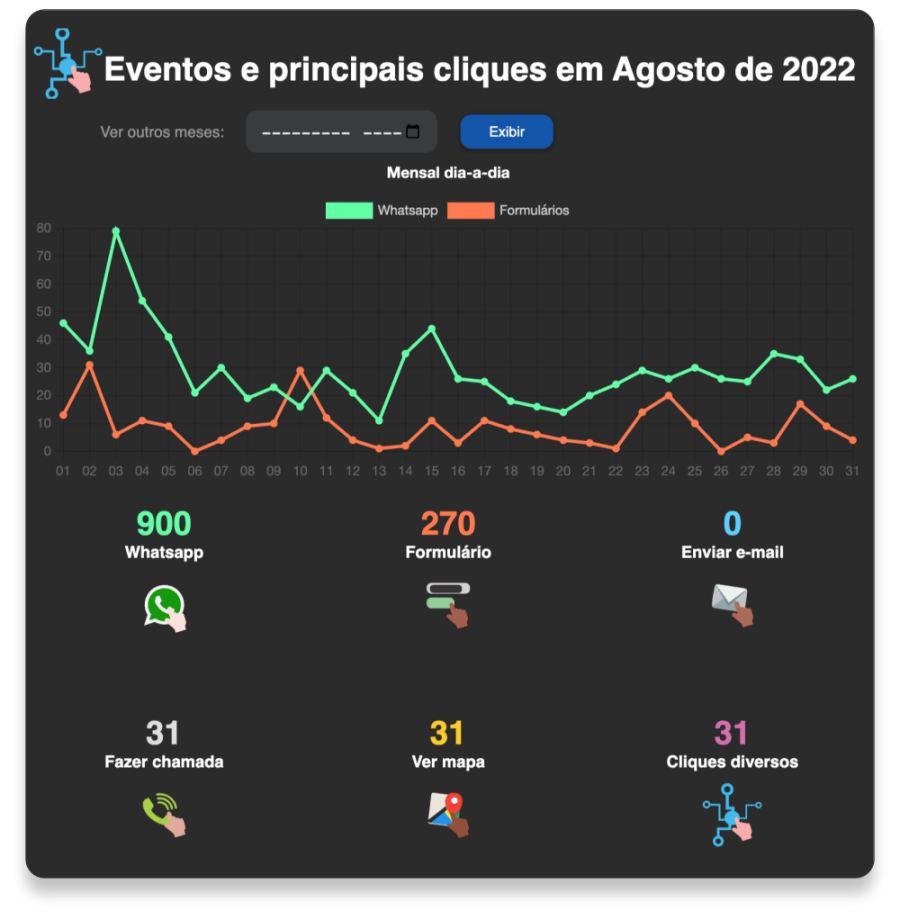
main events
With easy visualization, we display the main events that the web offers focused on companies, which are:
- Clicks to send messages by Whatsapp;
- Filling in forms;
- Clicks to send emails;
- Clicks to make a call (on mobile);
- Clicks to see the business on Google Maps;
- Multiple clicks to show navigability;
In addition, we separate the clicks to send messages by Whatsapp and forms to follow daily.
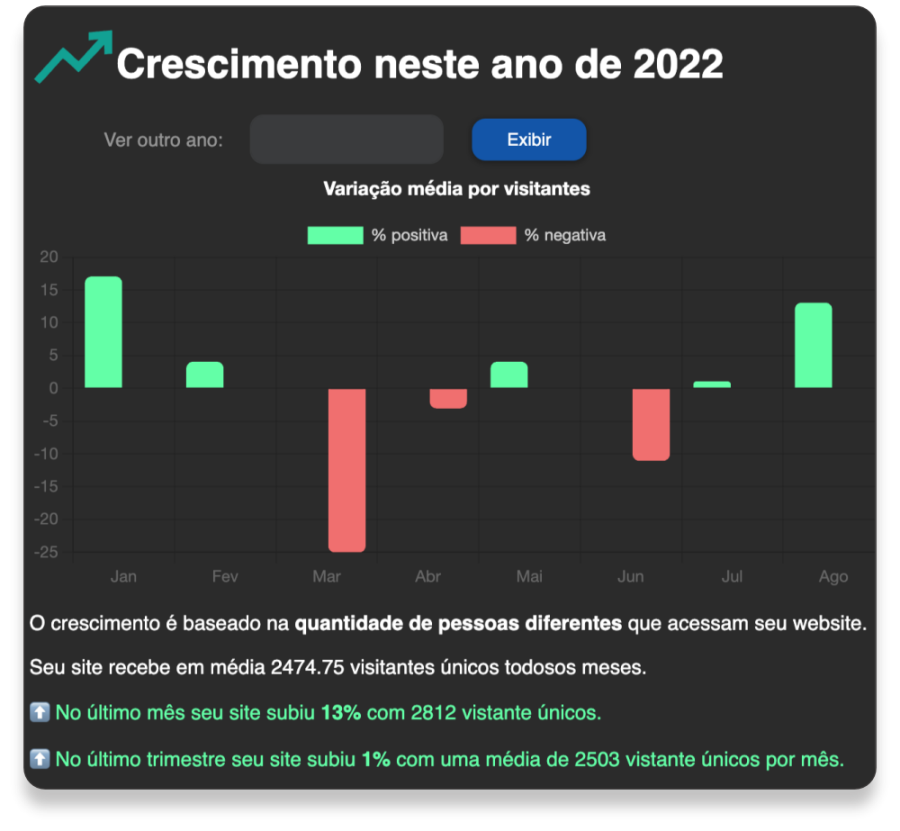
growth chart
One of the biggest difficulties for entrepreneurs is to clearly visualize whether the website grows or decreases in visits in general, so we separate a specific chart to understand the best months of the website and its performance related to the previous month and quarter.
Conclusion
It is extremely important to understand the performance of your website and how customers are interacting, this data allows you to optimize the user experience and measure the ROI (return on investment) of campaigns and actions carried out on the website in general.
In addition to these, we carry out constant updates so that our customers have a clear and consistent view of their entire web archive in order to increase effectiveness and results.
You might also like to read
Interago - The Eco Webdesign Customers Panel
A centralized Dashboard to manage the website, view visit reports and much more
On 27/10/2022 at 15:09 pm - Updated on 16/10/2023 at 08:53 pm
Interago Reports and Graphs to visualize your website performance
Interago's graphical and tabular reports are focused on the main goals of most companies and are easy to visualize
On 09/09/2022 at 11:11 pm - Updated on 16/10/2023 at 08:53 pm
What is Interago and how did we arrive at this solution that is more than a CMS
Interago is a Digital Experience Platform, that is, a link builder focused on how visitors access your pages and control to communicate and manage these contacts.
On 28/03/2022 at 11:34 pm - Updated on 16/10/2023 at 08:53 pm
How to create a cost-effective, WordPress-free, manageable news portal
A manageable news portal can be a great business opportunity, as the links receive visits and programmatic media are printed for the visitor.
On 28/03/2022 at 11:57 pm - Updated on 16/10/2023 at 08:53 pm


